 English
Analysis #
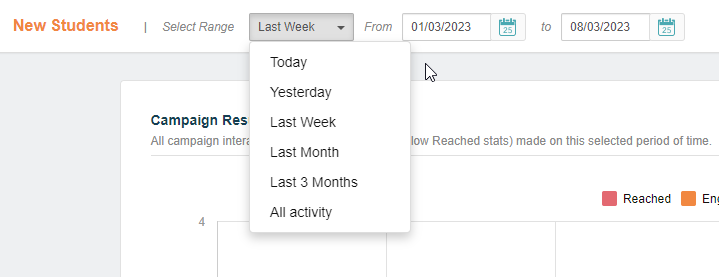
In this section, you can select a single campaign or a campaign flow to view a statistical analysis over a fixed period (today, yesterday, last week, last month, and last three months) or a user-defined time window.
It is also possible to identify when the activity peaks occurred by looking at the accompanying charts and timeline.
General Statistics #
The analysis of a single campaign displays the number of:
- Customers reached and engaged
- Leads generated
- Conversions and dismisses
The image below shows the results overview and the customer activity over a given interval. The possible results (Reached, Engaged, Leads, Conversions, and Dismisses) are displayed in different colors for better visualization and can be toggled on or off by clicking on the text at the top of the chart.
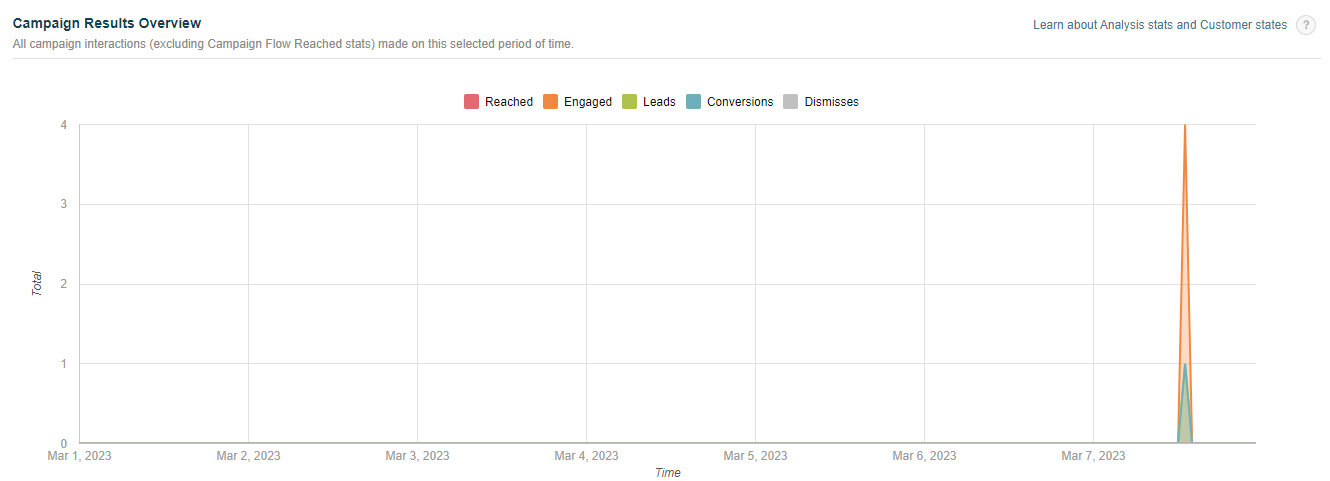
- Reached: total unique customers reached through the campaign during the time window under consideration. In other words, this metric only changes when a given customer views the campaign in question for the first time.
For example, if you choose Yesterday, the value shown under Reached will show the number of persons who were reached through the campaign for the first time yesterday. This value is independent of how many customers viewed the campaign previously. Thus, Prisma Campaigns provides a more accurate glimpse into the campaign scope over time.
Engaged: number of customers who opened an email communication. This state only applies to the Email channel, as it is an intermediate step between Reached (when the customers receive the message) and Lead (when they click on a link in the email body).
Leads: total customers who started the campaign funnel.
Converted: number of customers who completed all funnel steps and reached its end.
Dismissed: total customers who dismissed the campaign.
Although the default range for analysis is Last Week, you can choose one of the others at any time. In any event, the behavior is the same: Prisma Campaigns will show the values of the interactions made and the results obtained during the period in question.
In addition to the above chart, the same information is available in the following table. It is important to note that this includes both the total results of the campaign and the metrics for each channel individually. The charts below (interactions by channel and by the hour) show further details. The latter indicates the time of day when the interactions took place.
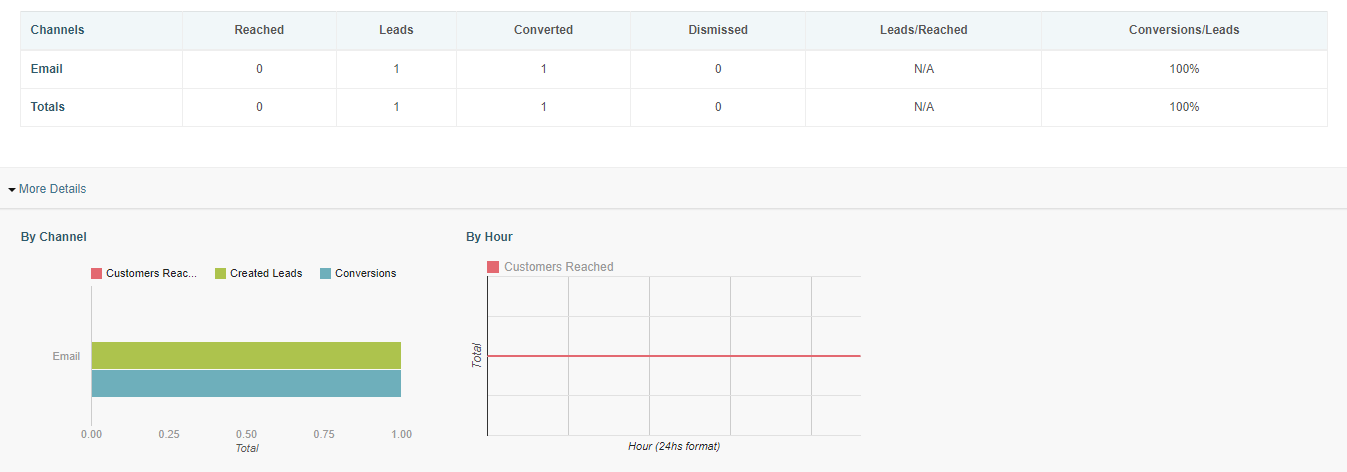
The summary and charts of interactions by channel and by the hour can be beneficial to determine the most effective channel and time of day when the number of leads over customers reached is higher.
Analysis Sample Case #
The different customer statuses and the meaning of the associated statistics are summarized below:
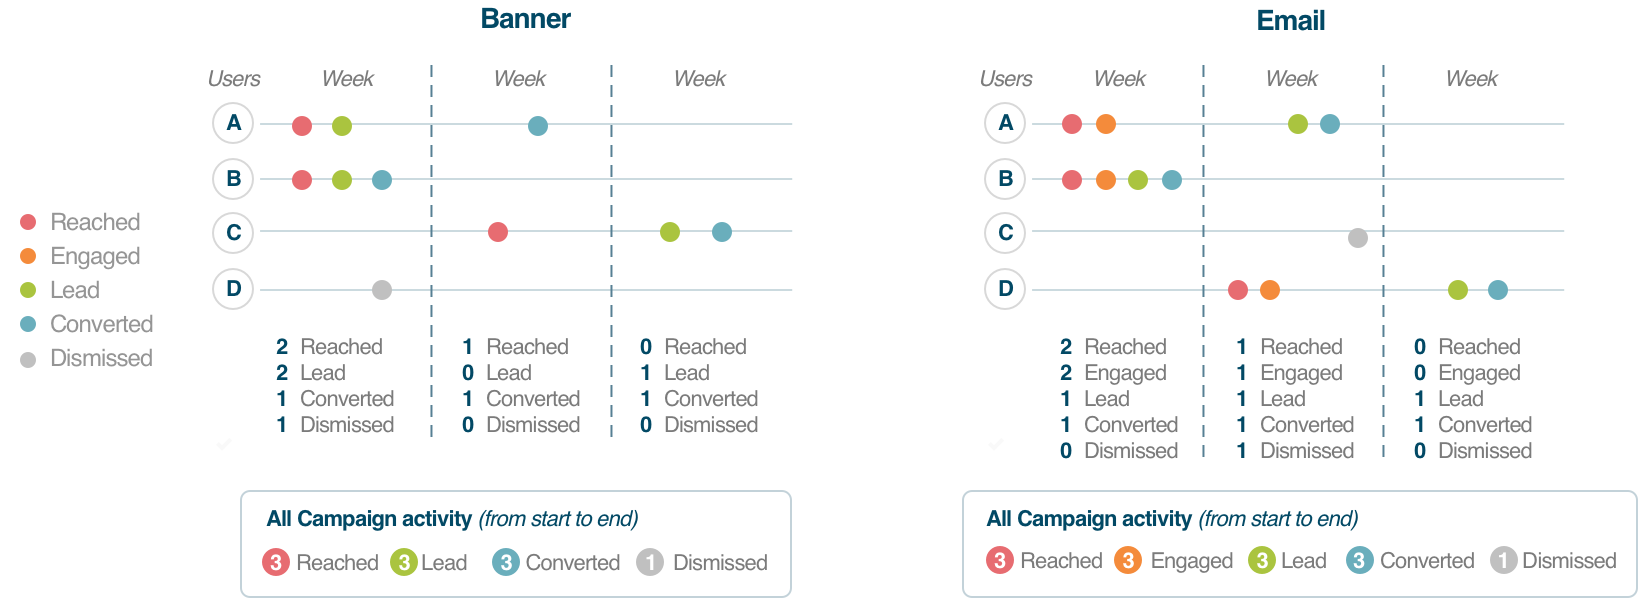
A, B, C, and D are four arbitrary customers.
Columns captioned with Week represent consecutive weeks under analysis.
Taking A as an example, we observe the following:
- Week 1: the customer was reached through Banner and Email. A lead was created through the former, whereas the latter shows that he opened a message but did not interact with the campaign.
- Week 2: customer converted through Banner, created a lead via Email by clicking on a link in the email body he had received, and finally converted through the same channel.
- Week 3: no activity.
Other details of interest are:
- B was reached through Email during Week 1. Within the same period, he opened the message, clicked on a link, and converted. After that, there was no activity recorded for the following two weeks.
- D dismissed the campaign via Banner during Week 1. C did the same for Email during Week 2. However, the latter was also reached through Banner in this period and created a lead and converted during Week 3.
Analysis statistics make sense as you consider separate time windows and the interaction with customers in them. For that reason, Lead and Converted are equal to 1 during Week 3 for both channels while the values for the other statuses are 0. In other words, no new customers were reached during that period.
Export Results #
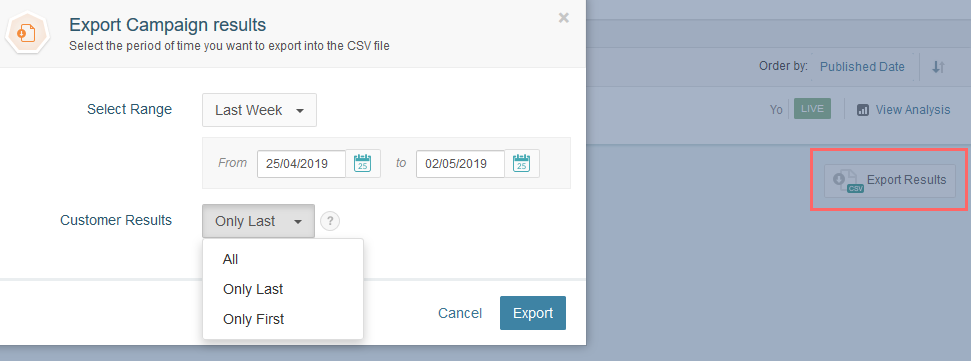
If you wish to download the campaign results, click on Export Results inside the campaign summary. Next, select a time window (Today, Yesterday, Last Week, Last Month, or Custom) and which final results (All, Only Last, or Only First) you are interested in and want to export.
A given customer may have several final results (converted, dismissed, or unsubscribed) in the same campaign. This outcome is possible since an individual can convert, dismiss the campaign, or unsubscribe from the associated communications. In this case, the customer will be contacted again after the reset period ends and will produce a separate outcome (which may be the same or different from the previous one).
The available options are:
Only Last (default) and Only First will export the last or first final results only, respectively.
If All is selected, all final results will be exported. This may include more than one record per customer.
For the predefined time options, the end date is automatically selected as one day after the current date. Thus, Last Week covers one week from tomorrow counting backward.
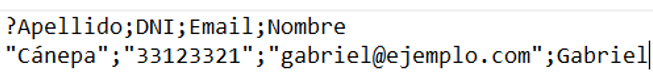
Based on the fields chosen for the export (Apellido, DNI, Email, and Nombre in this case), the following image shows a customer named Gabriel Cánepa in the results file:
Campaign Statistics by Channel #
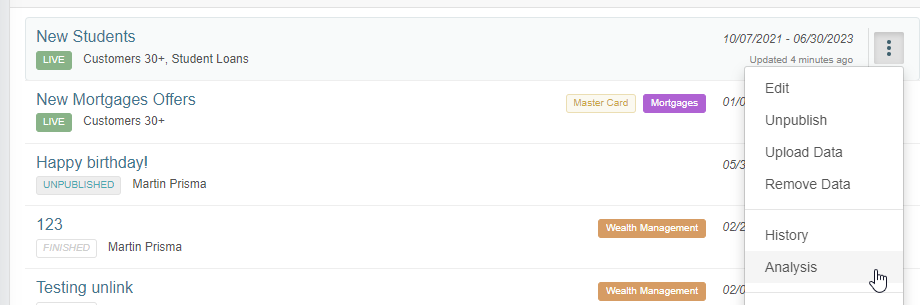
To view the analysis of a campaign, expand its menu and click on Analysis as shown in the image below:
In addition to the interactions summary table and the associated charts, the analysis allows to perform a more detailed inspection of the campaign by looking at the historical statistics by channel or channel group:
The Banners tab shows the number of unique customers reached, the generated leads, and the resulting conversions during the time interval under consideration.
In Popup, you can view the number of times the pop-up window was displayed, along with the generated leads and associated conversions if they exist.
Similarly, Referrals provides a report on leads and conversions through social networks.
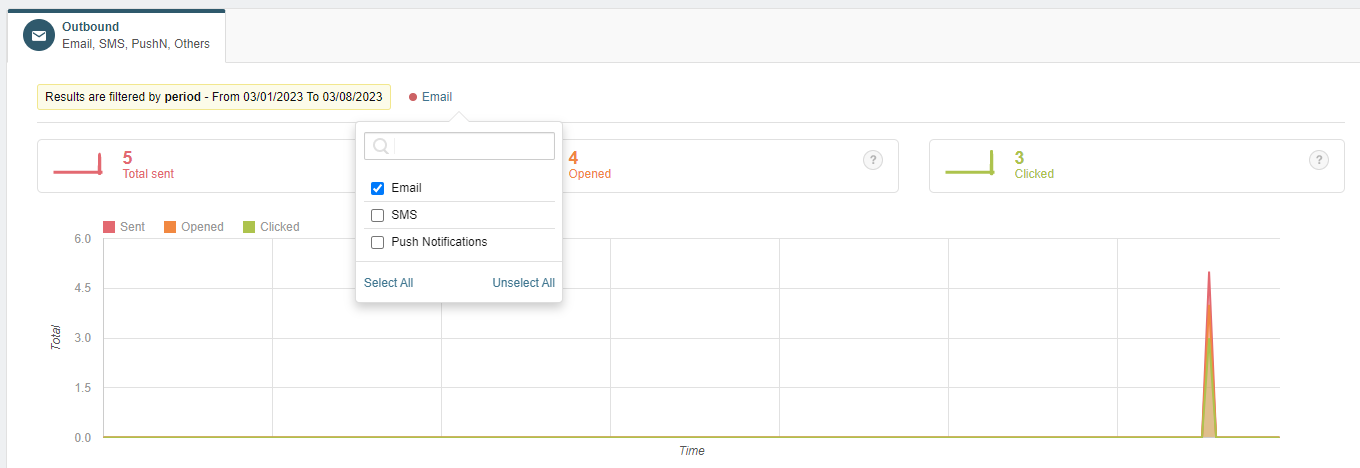
Outbound (email, SMS, and push notifications) makes it possible to filter by each outbound channel and shows the total number of communications sent, those that were opened by unique customers, and the total clicks. It is important to note that Clicked does not change if a given customer clicks twice or more on the same link since a lead is only generated the first time. When you select a given channel, the statistical summary and the associated charts are updated as illustrated in the following image after filtering by Email:
Banners #
Inside each channel’s analysis, banner statistics deserve special attention since they provide the following information:
The number of unique customers reached and total banner visualizations.
Generated leads through customer interaction.
Resulting conversions.
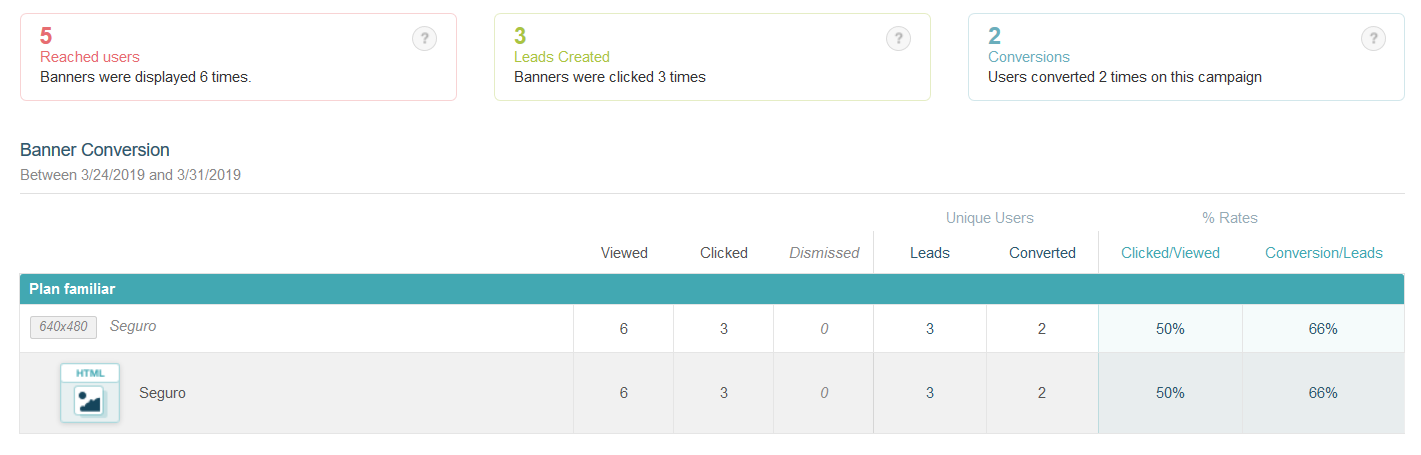
The image above shows the table of resulting conversions completed through this channel. In this example, a banner called Plan familiar (located inside a placeholder named Seguro) is the only existing banner in the campaign. If there were others, they would be visible here.
A banner ranking in this section helps identify the images and placeholders that produce more leads and conversions more easily:
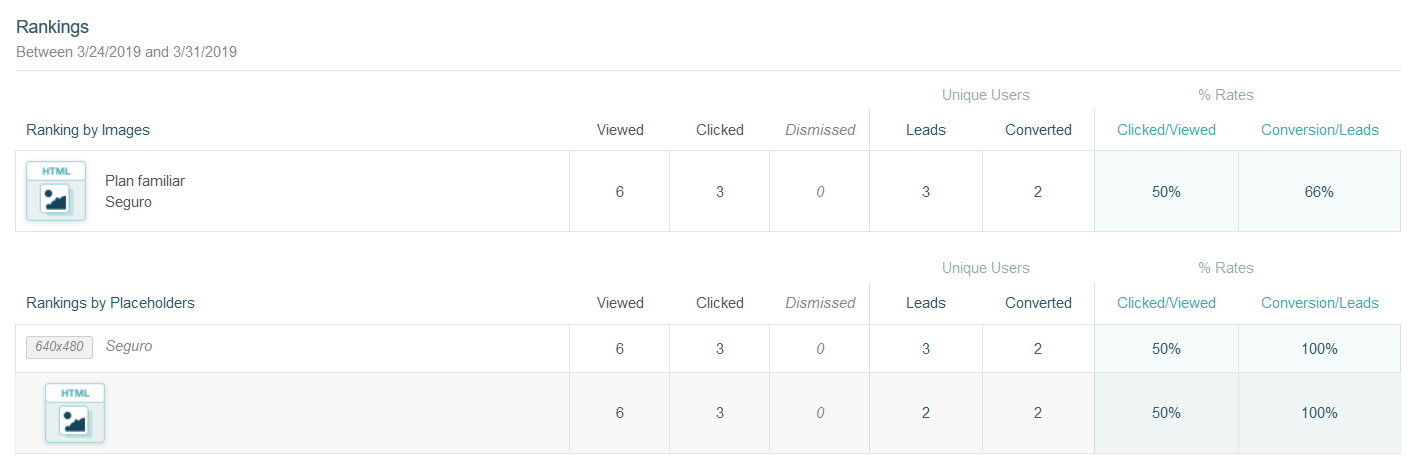
As you can see above, Plan familiar has only one image and is associated with only one placeholder. If you include two or more, the ranking will be ordered by the conversion effectiveness of each image and placeholder.
Outbound #
Most likely, the total number of communications sent will not match the value shown under Reached. The former may include messages delivered before the period under consideration, which impacts the latter.
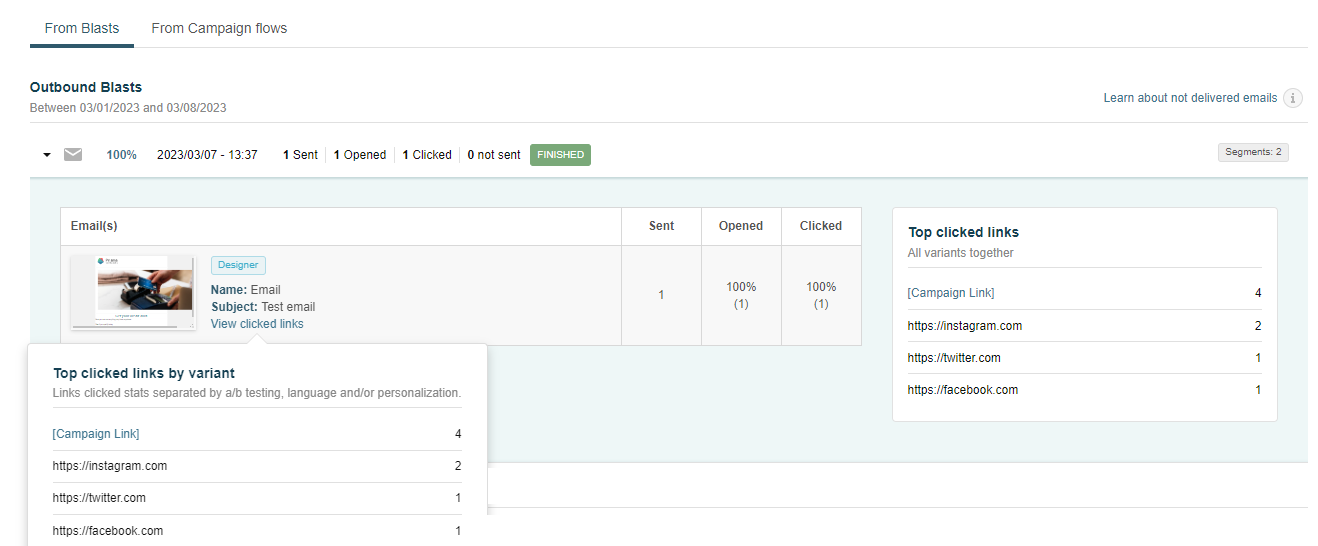
For a campaign where the Email channel is configured, the From Blasts section is of particular interest. As the image below illustrates, it shows the percentage of emails that your customers opened and details about all the links that they clicked. This list includes internal links ({{campaign.link}} and {{campaign.unsubscribe}}) and external ones (any other website).
When you use SMS, you can view the same statistics mentioned earlier:
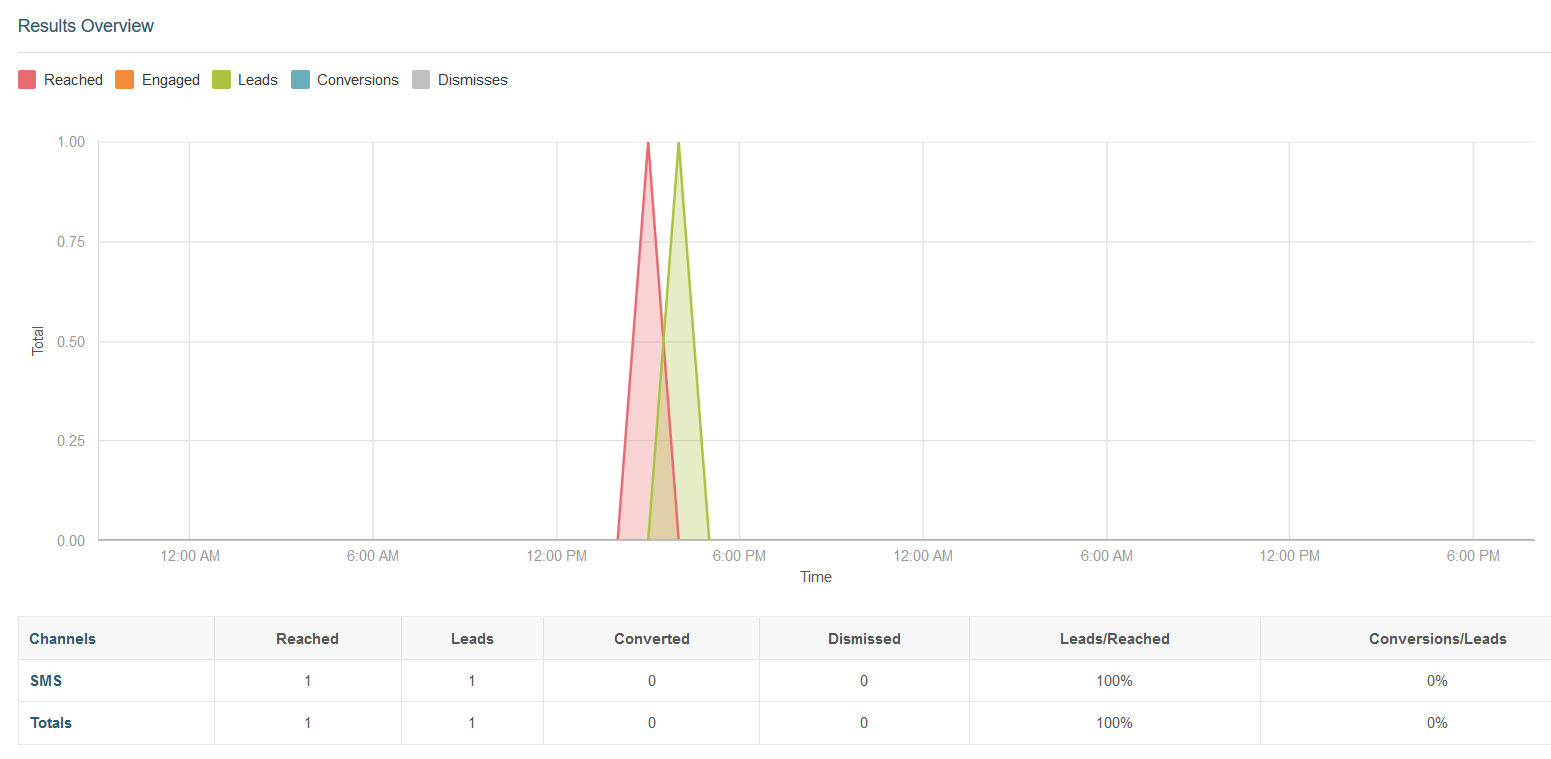
In the example from the above image, only one customer was reached and one lead was generated. Thus, the Leads/Reached ratio is 100%. As this did not result in a conversion, Conversions/Leads equals 0%.
Campaign Flows #
The campaign flow analysis allows observing how many people entered, exited, and walked through the flow in given periods. In addition to the statistics and details for each flow step based on the time window, the tool enables individual tracking of customers participating in the process, making it easy to answer questions such as which step each person is on, how long they have been there, and what their current status is.
When you click on a campaign flow, the analysis screen presents two tabs: Flow Analysis and Customers List.
Flow Analysis #
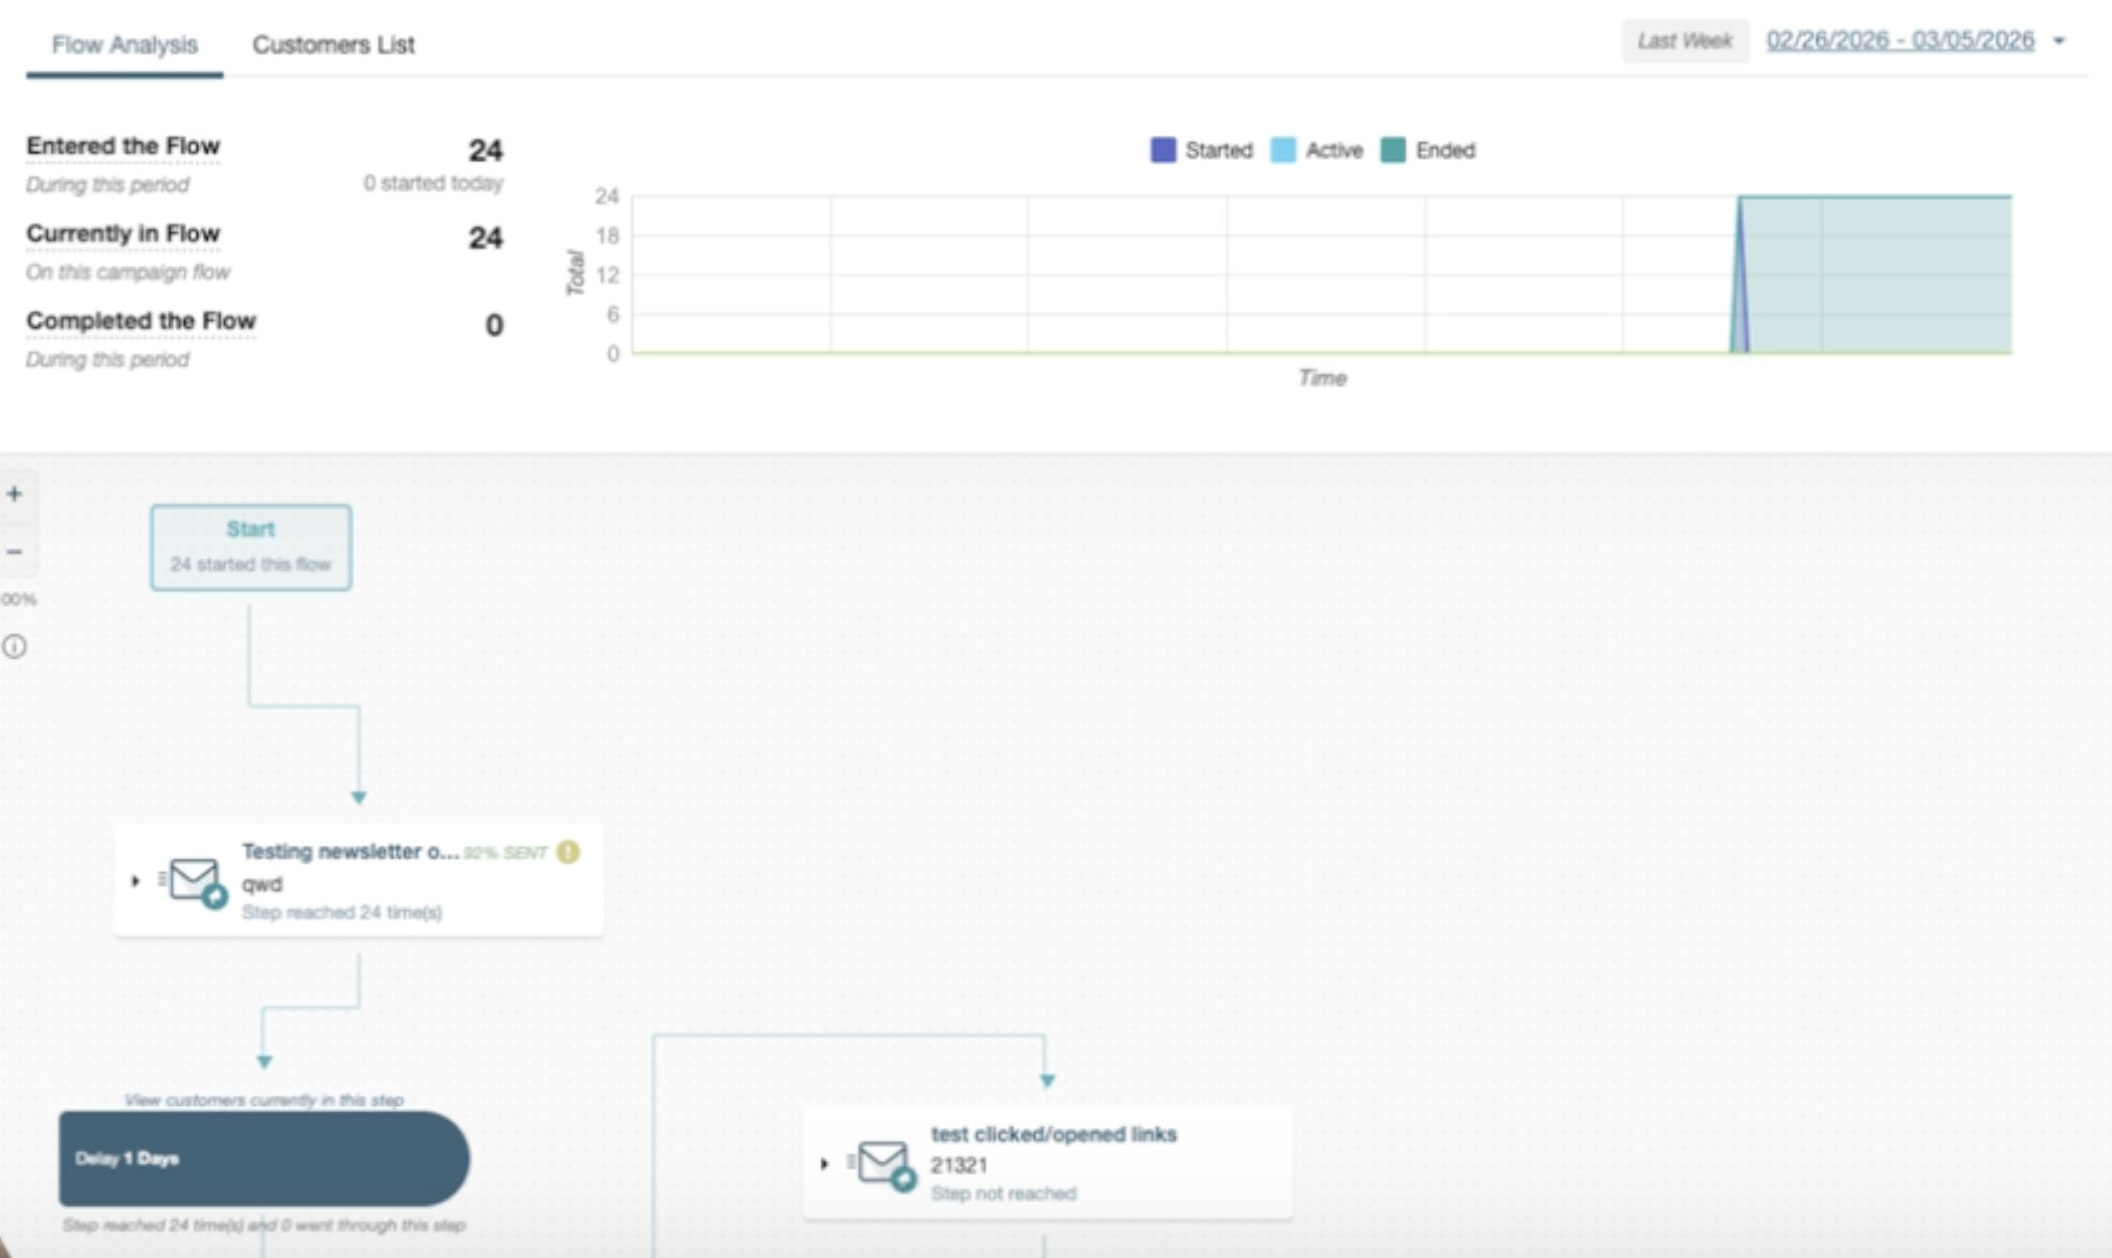
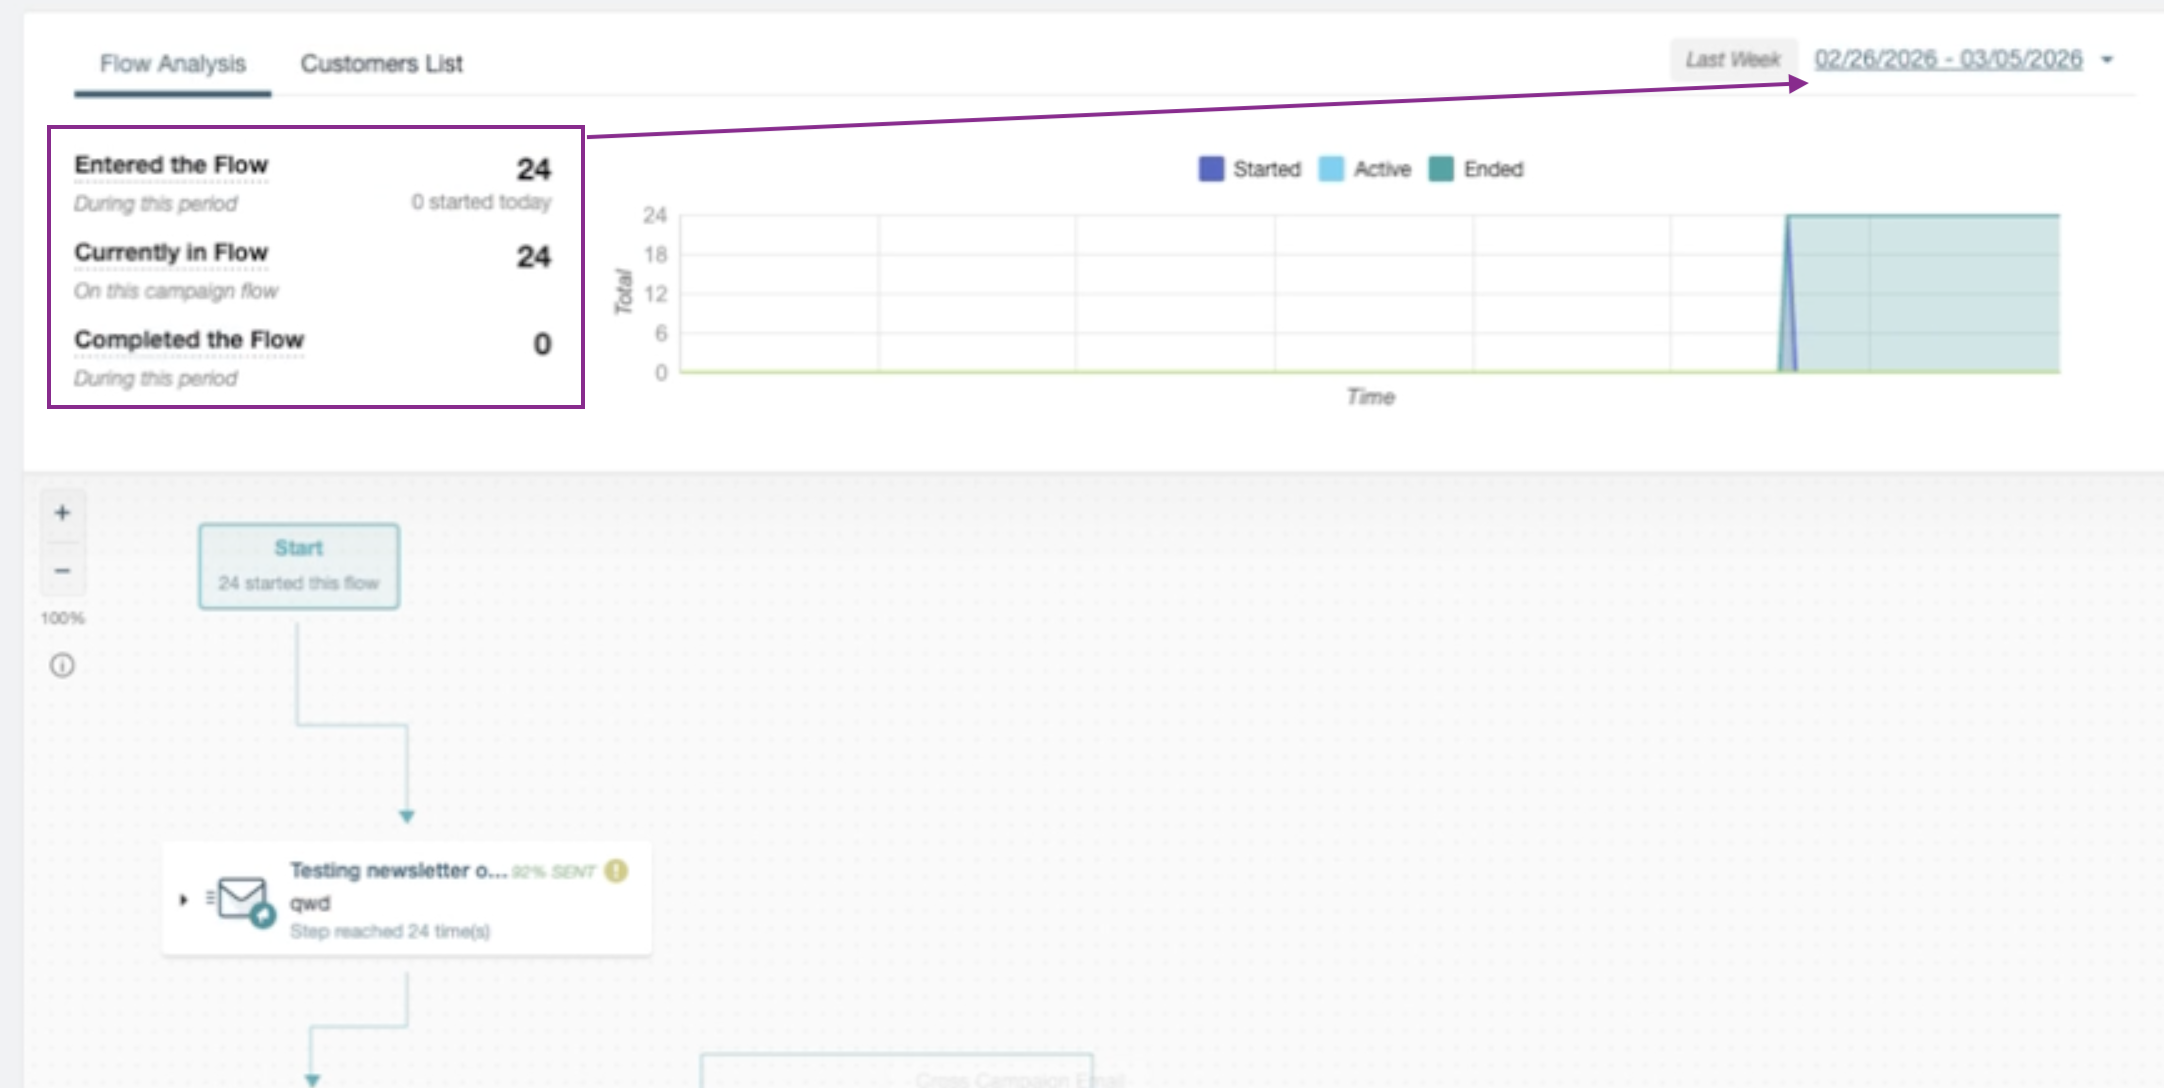
The Flow Analysis tab displays the overall flow metrics along with an activity chart for the selected period:
- Entered the Flow: number of customers who entered the flow during the period.
- Currently in Flow: customers currently going through the flow.
- Completed the Flow: customers who completed the flow during the period.
Below the metrics, the complete flow is displayed with the details of each step.
The metrics and the period selector are highlighted in the box shown in the following image:
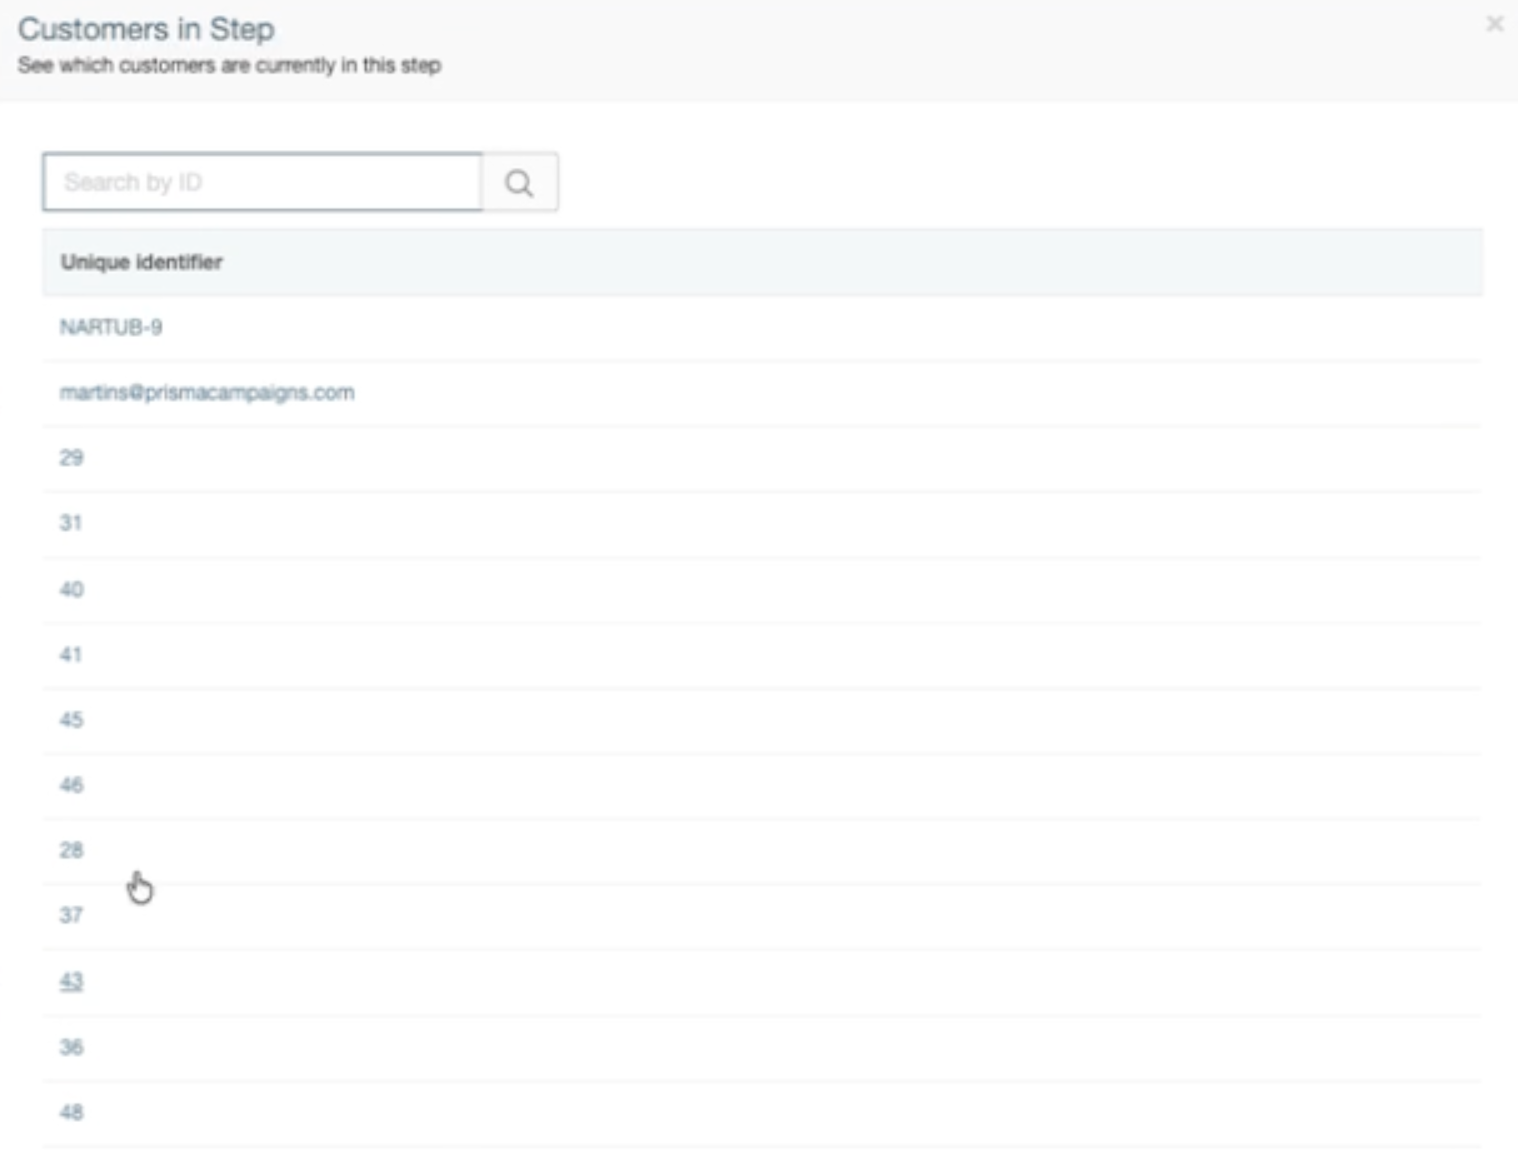
In campaign flows, people only stop at delay steps. Therefore, clicking on one of them displays the list of those who are currently active at that point:
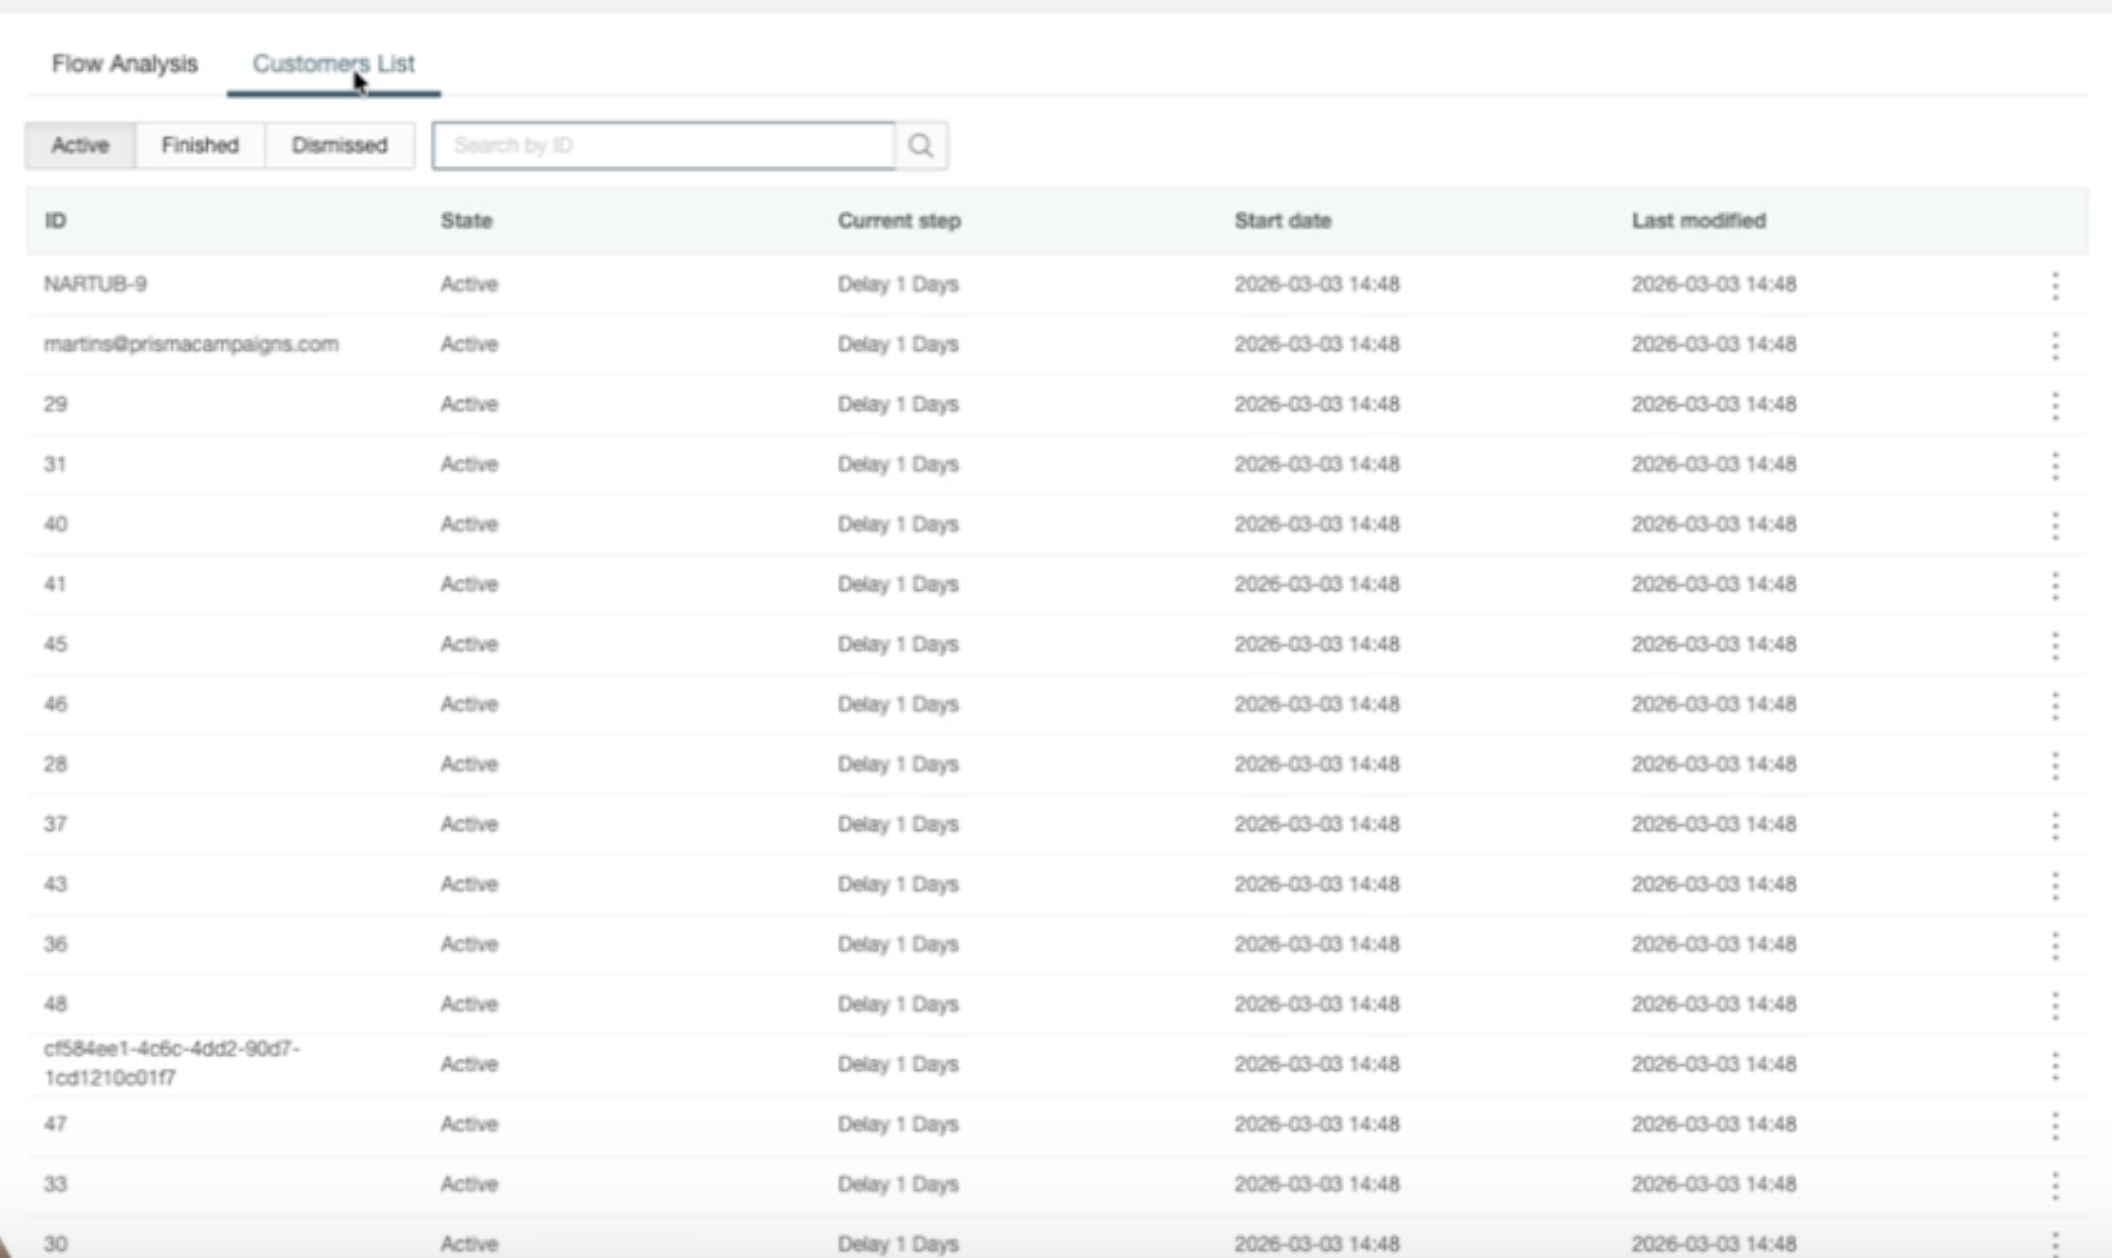
Customers List #
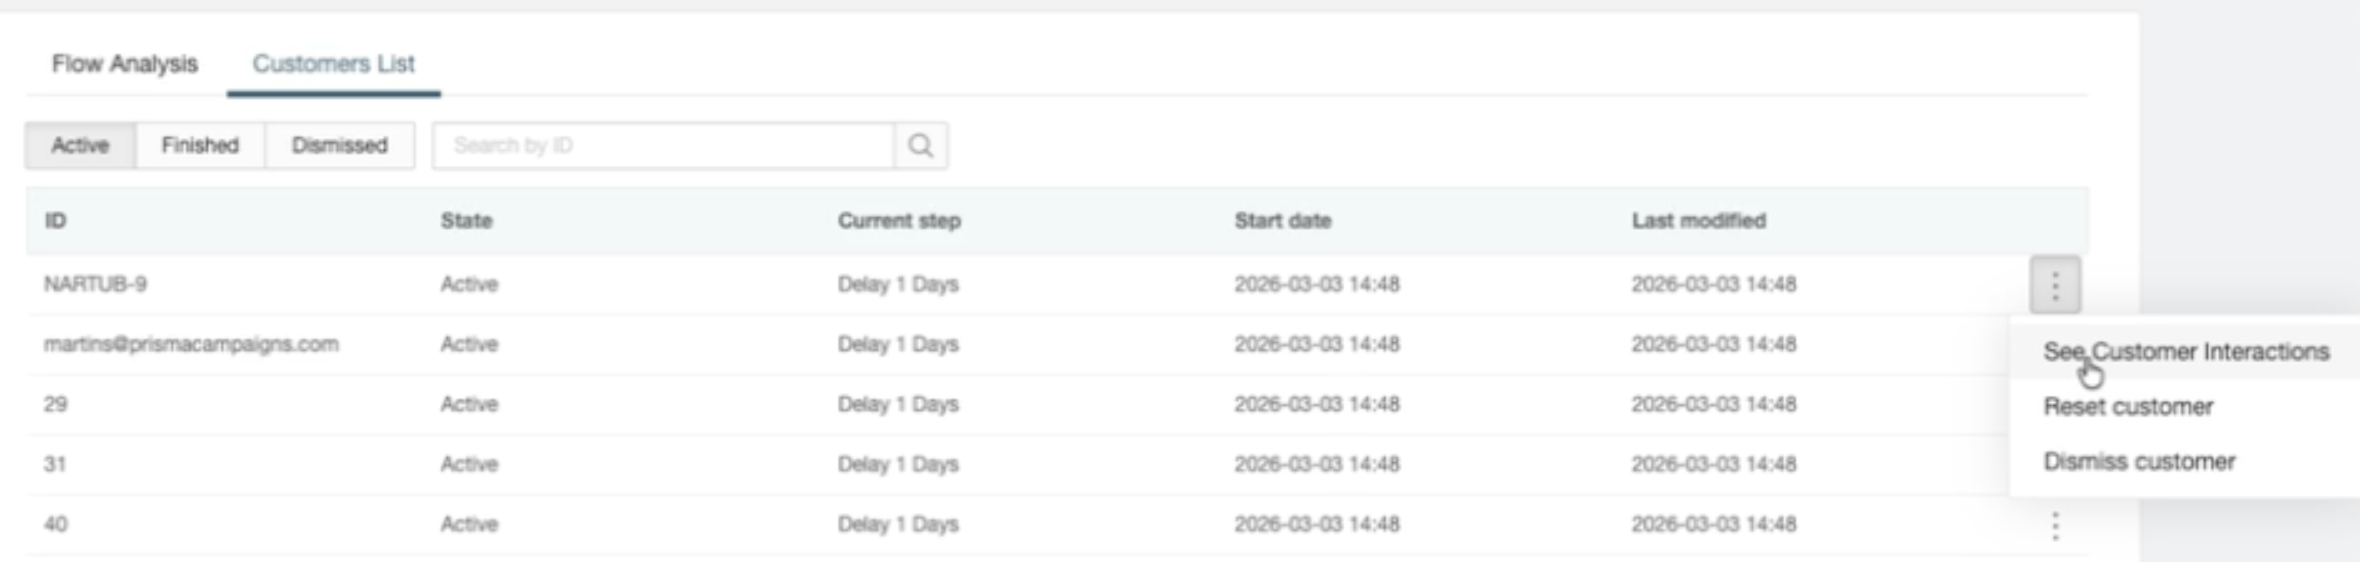
The Customers List tab enables individual tracking of each customer within the flow. The list can be filtered using the Active, Finished, and Dismissed buttons, which correspond respectively to customers currently going through the flow, those who completed it, and those who were dismissed. Each entry shows the current step (typically the delay between steps), the start date, and the last modified date.
Clicking on a customer’s action menu (three-dot icon) reveals the following options:
- See Customer Interactions: view the customer’s interactions within the flow.
- Reset customer: reset the customer within the flow.
- Dismiss customer: dismiss the customer in the context of the flow.
Selecting See Customer Interactions displays the detail of each interaction the customer had with the different flow steps, including the step they went through, the corresponding date and time, and a preview of the associated communication if applicable.
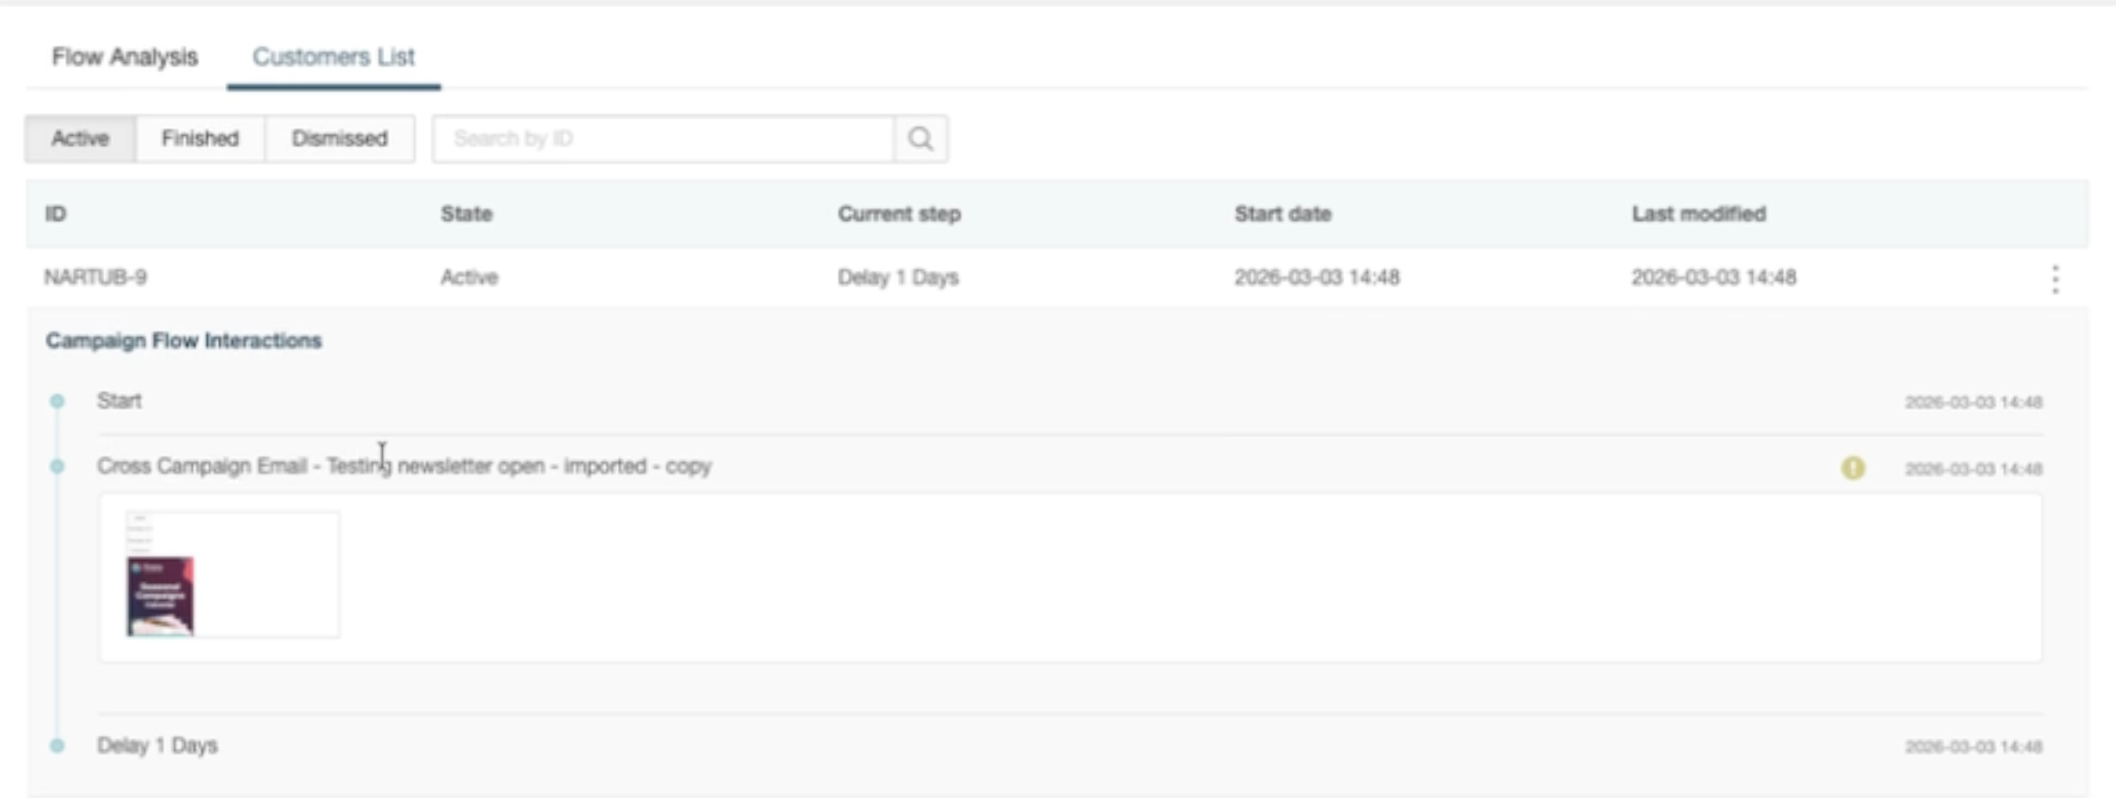
The Customers List tab is particularly useful for understanding the situation of each person who entered the flow, as it allows quickly identifying which step they are on, how long they have been there, and whether they have already finished or been dismissed. This complements the overview provided by the Flow Analysis tab, making it easier to investigate individual cases without needing to export data.
Settings Audit #
To keep track of the changes made to its settings, the campaign history provides a complete audit of all modifications, who made them, and when. To view the complete record, click on the campaign name and then History. The result is illustrated in the image below:
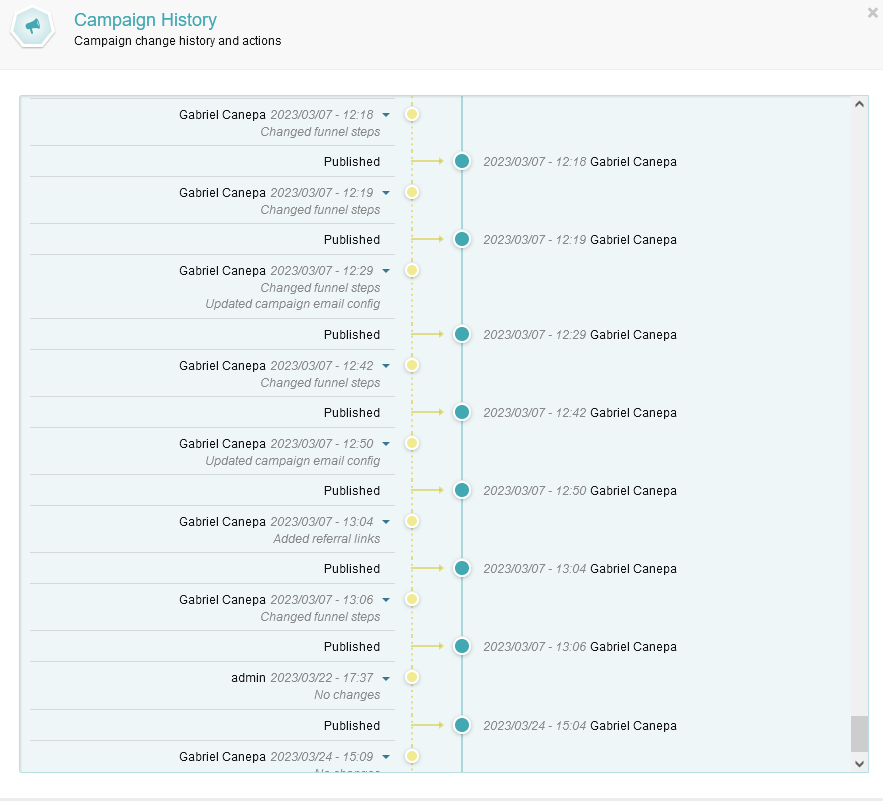
Thus, it is possible to revert changes if necessary or work on them more easily.