 English
Operations #
This Prisma Campaigns menu includes resources that provide visibility to the tool’s internal operations. These include the running system processes, infrastructure usage, the most used integrations/campaigns/banners/placeholders in a given period, and the funnel debugger.
Processes #
Under Processes, you can visualize the tasks that are currently running in the system. These include blasts, synchronizations, data imports/exports, and CPU usage during the last hour. In case the infrastructure consists of two or more servers, the same data will be available for each of them.
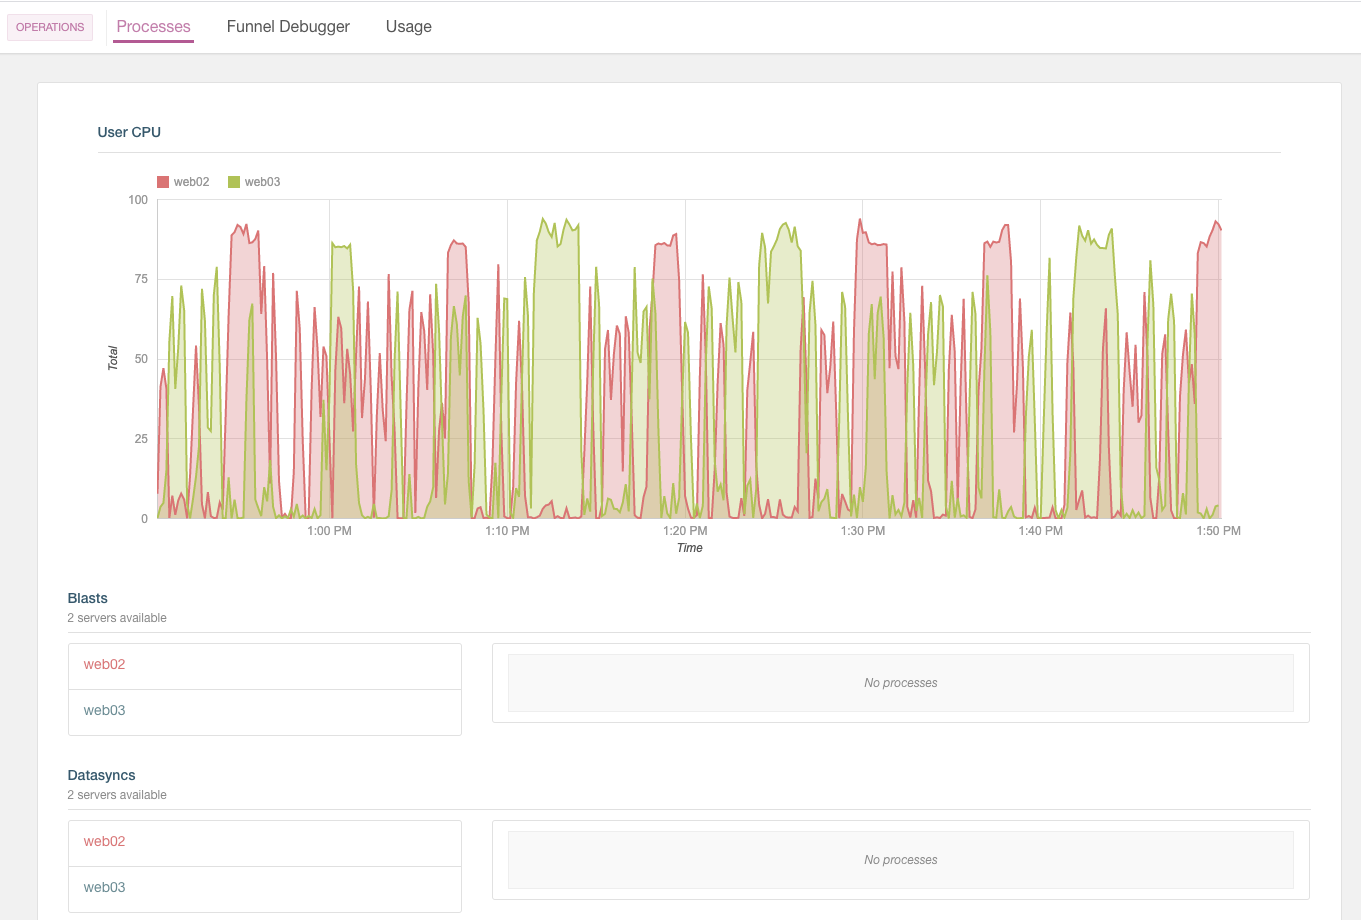
In the image above, web02 and web03 are the machines that fulfill the requests for Prisma Campaigns. You can use this information to diagnose which operations are causing usage peaks to space them out or increase infrastructure resources to carry them out more effectively.
Funnel debugger #
The funnel debugger allows you to monitor funnel executions to determine if calls to external web services or integrations with third parties are working correctly. This resource also makes it possible to examine customer interactions during the process.
After selecting the Funnel Debugger tab, you can filter the information using the following parameters:
- List of events during the last hour, last 6 hours, last 24 hours, and last week
- Campaign
- Label (action, error, or information)
- Customer ID
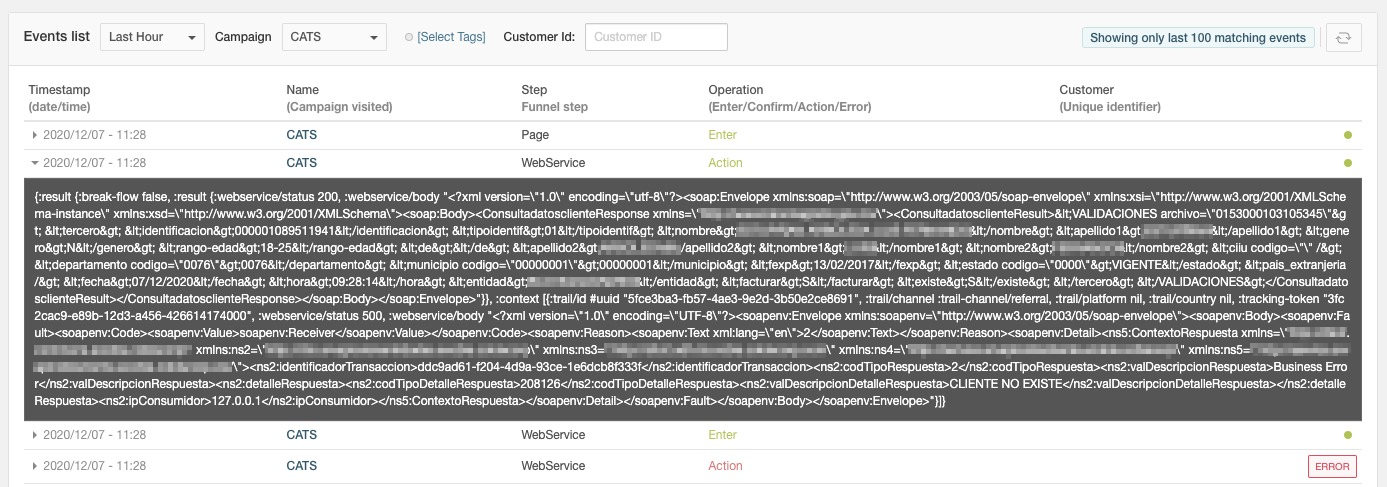
As illustrated above, the result includes the fields listed below:
- The timestamp shows the date and time of the record in question. To view more details about each message and view it in EDN format, click on the triangle at the left.
- Name and Step represent the campaign name and the funnel step where the message originated.
- The operation can take any of the following values based on the outcome of the corresponding operation:
- Enter is when the customer starts the funnel.
- Confirm is generated when the client confirms interest (for example, when he or she enters personal information in a data capture form).
- Action is a funnel step that is not associated with a direct interaction with the user.
- Error appears when an issue occurs during the step in question. It does not refer to a data validation.
- Customer indicates the customer ID (if available).
- The last column (without a title) allows you to visualize errors or successful completions at a glance.
By default, the funnel debugger will show the last 100 records that meet the chosen filter criteria.
Usage #
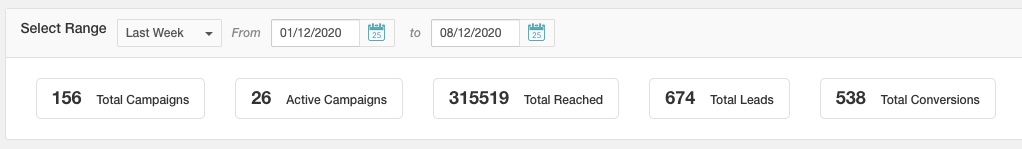
This section shows the usage stats by application as defined in the system. Particularly, you will observe the following aggregated data for the period under consideration:
- Total campaigns
- Number of active campaigns
- Reached customers
- Leads
- Conversions
Furthermore, for the same time window, you will see charts corresponding to:
Synced pages:
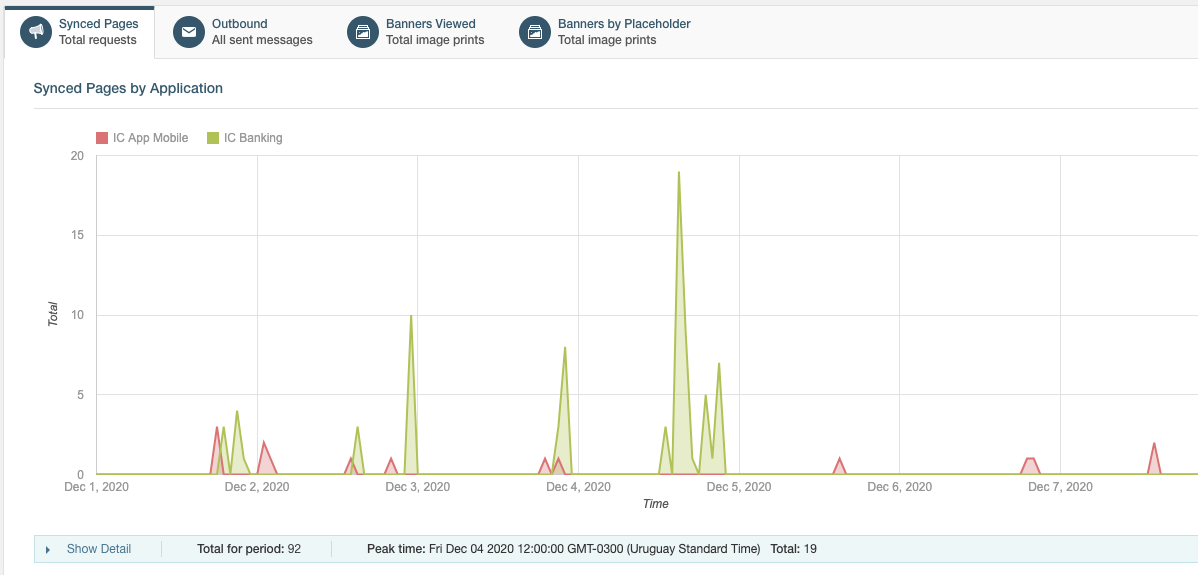
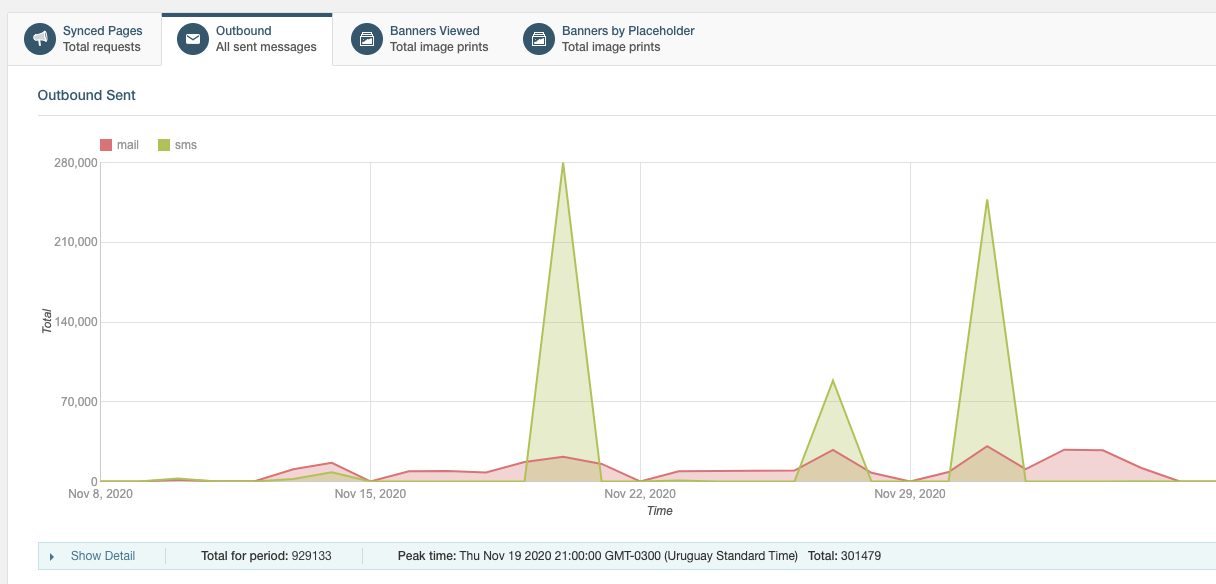
Sent messages:
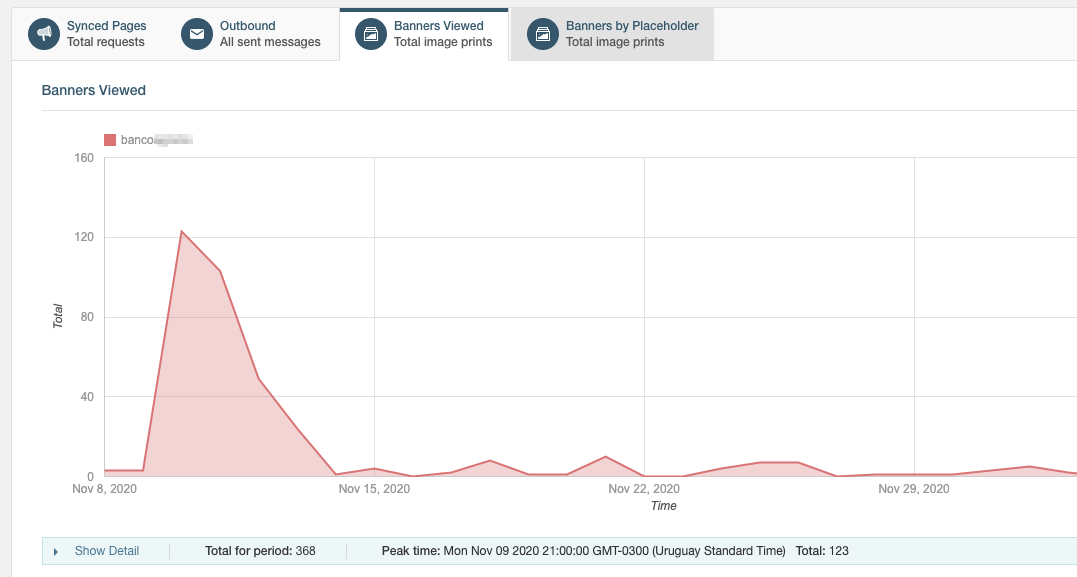
Banners viewed:
Banners by placeholder:
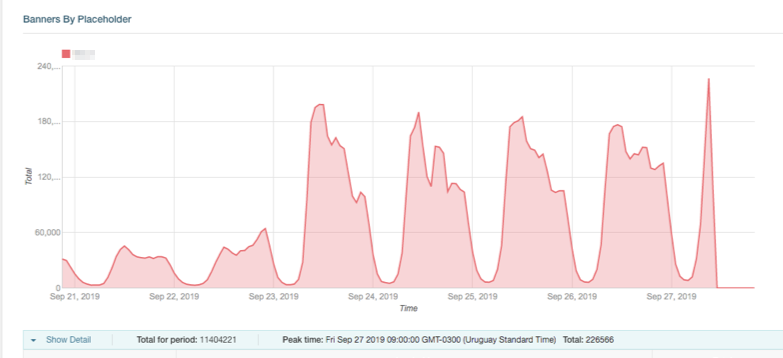
By inspecting these graphics, you can determine which integrations, campaigns, banners, placeholders, and outbound channels were the most frequently utilized, and when those peaks occurred. For this, you can use the Show Detail section under each chart to see the total, when the highest use occurred, and more details about the records from the period.